HPT Log
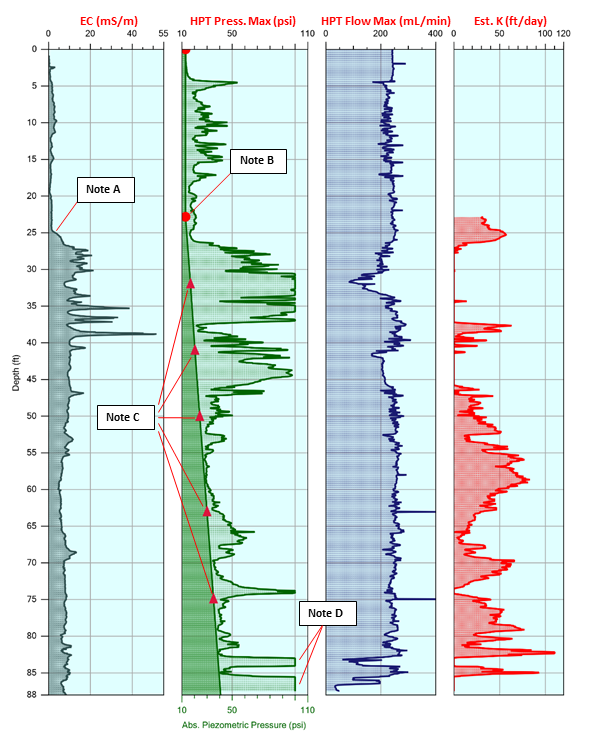
The primary log from the HPT system is the log of HPT injection pressure with depth. Injection pressure correlates well with formation permeability and gives the HPT user a view of permeability with depth. Using this log, an experienced practitioner can determine permeable zones, potential contaminant or seepage flow paths, zones that will yield groundwater to samplers, and identify zones within which to set monitoring or production wells.
Log Components
 Electrical Conductivity
The Electrical Conductivity (EC) of the soil is logged simultaneously with the HPT data utilizing an integrated Wenner array. EC often provides insight into the stratigraphy and correlates with the HPT pressure plot in many instances. Typically an increase in EC (and increase in pressure) is indicative of finer, tighter soil types.
HPT Pressure Plot
The HPT pressure gives insight into hydraulic properties of the soil as water is pumped into the formation at a constant rate. The pressure (unlike EC) is independent of certain factors such as pore water chemistry or mineralogy (contaminants, brines) and so further aids in defining soil/hydraulic properties of the area of investigation.
Water is pumped out of the HPT probe and into the formation at a constant rate of typically 250 ml/min. A change in flow (usually accompanied by an inverse pressure change) is an indicator of the hydraulic properties of the soil.
Estimated K Plot
The estimated hydraulic conductivity (K) is internally calculated by utilizing pressure and flow data in conjunction with dissipation tests performed at each location. This data is useful for directing sampling, remediation and slug testing protocols.
Note A:
Increasing EC readings starting at 25 feet indicate a transition to finer grain silt with clay stringers at 35 to 39 feet.
Note B:
The hydrostatic water level has been indicated with a round marker at 22.5 feet.
Note C:
The Absolute Piezometric pressure has been calculated and graphed with the individual dissipation test points indicated by triangular markers. The pressure increases relative to the head pressure as soon as the water table is encountered. Since these points form a straight line (no inflections) it can be inferred that the water table is hydraulically connected from the first to the last dissipation test.
Note D:
The significant pressure increase (transducer maxed out, 100 psi) and drop in flow at 83 to 88 feet is due to tight formation conditions discovered by HPT parameters (and not observed by EC measurements).