UVOST Log
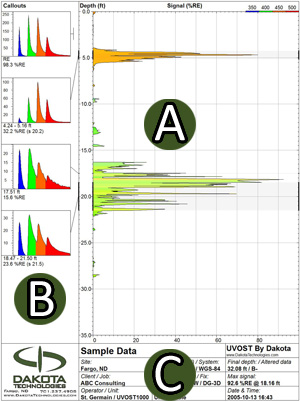
Following data acquisition, the operator may output a jpeg image or pdf of the data. The operator also has control over the five callouts shown on the left side and the scale of the depth and signal axis. Click for a larger image.
Log Components

A: Main Plot
Signal (total fluorescence) versus depth where signal is relative to the Reference Emitter (RE). The total area of the waveform is divided by the total area of the Reference Emitter yielding the %RE. This %RE scales with the NAPL fluorescence.
The fill color is based on relative contribution of each channel's area to the total waveform area (see callout waveform). In the example data, the difference between the motor oil (top, orange) and diesel (bottom, green) is clearly evident.
B: Callouts
Waveforms from single depths or depth ranges showing the multi-wavelength waveform for that depth. Basic waveform statistics and any operator notes are given below the callout.
The four peaks are due to fluorescence at four wavelengths and referred to as channels. Each channel is assigned a color. Various NAPLs will have a unique waveform fingerprint due to the relative amplitude of the four channels and/or broadening of one or more channels.
C: Info Box
Contains pertinent log info including name and location.